Blog
Written by Ira Hirschman and Jenna Goldberg
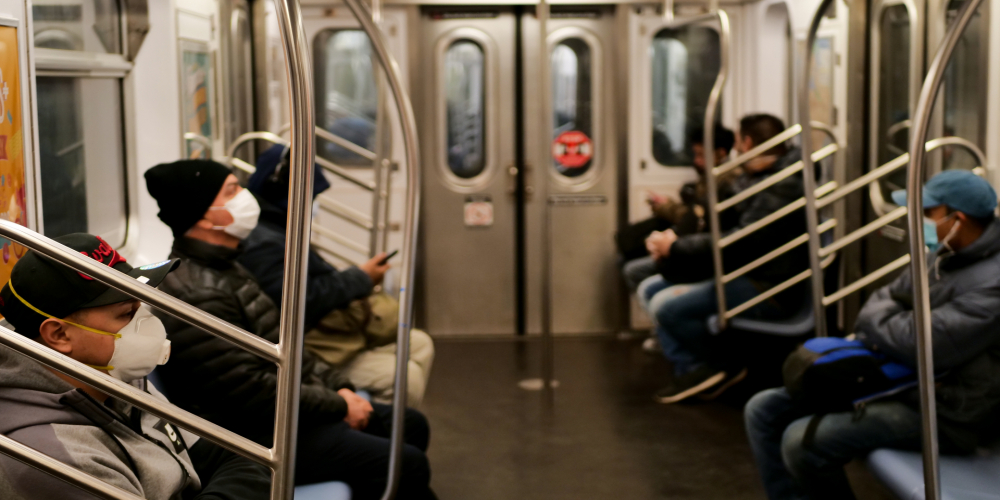
It has been nearly a year since our last blog about New York City and its COVID-19 related challenges and responses. At that time, uncertainty about how well the City would cope, as well as long-term prospects for recovery, were at their height. Since then, the national, state, and local public health responses have greatly improved. COVID-19 vaccines have been rolled out, and after initial difficulties in production, distribution and administration, vaccines are now plentiful, as is COVID-19 testing.
It has been nearly a year since our last blog about New York City and its COVID-19 related challenges and responses. At that time, uncertainty about how well the City would cope, as well as long-term prospects for recovery, were at their height. Since then, the national, state, and local public health responses have greatly improved. COVID-19 vaccines have been rolled out, and after initial difficulties in production, distribution and administration, vaccines are now plentiful, as is COVID-19 testing.


Spatial data is at the core of transportation analysis. Land use patterns, including the density of jobs and homes, and the locations of transportation infrastructure, such as stops, stations, and intersections, are frequently used to answer transportation planning questions. It is often useful to generate metrics at for a geographic zone. Not only does this allow for mapping and visualization, it often reflects the way that people use a transportation system – while a bus stop or rail station is located at a single point, passengers access it from the surrounding zone. In multi-modal analysis, considering zone-to-zone rather than point-to-point travel allows performance and accessibility assessments to compare or combine different modal options that serve the same areas.